What Is a Planogram? Planogram Compliance and How to Check It
What a planogram is, why planogram compliance matters for retail and FMCG brands in Indonesia, the KPIs to track, and how AI checks shelves from photos.
In this article
Every retail and FMCG brand negotiates for shelf space. A planogram is how that space is supposed to look. The hard part is knowing whether every store actually follows it.
Want to check shelves at scale? See our AI shelf monitoring service.
What Is a Planogram?
A planogram is a diagram that shows exactly where each product goes on a shelf or display: which shelf, which position, how many facings, and next to which products. Brands and retailers use it so the range looks the same in every store, and so the products that matter most get the best spots.
What Is Planogram Compliance?
Planogram compliance is how closely the real shelf matches the plan. A store is compliant when the right products are in the right place with the right number of facings, and promotional materials are in place.
The KPIs Worth Tracking
| KPI | What it tells you |
|---|---|
| Planogram compliance | Share of products in the right place with the right facings |
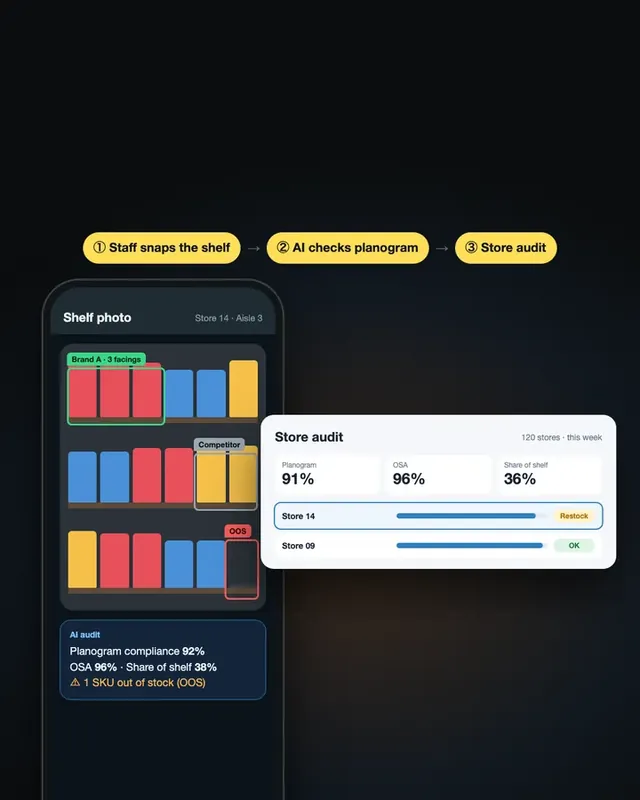
| On-shelf availability (OSA) | Whether products are actually on the shelf, not out of stock |
| Share of shelf | How much of the shelf your brand holds versus competitors |
| POSM compliance | Whether price tags, wobblers and promo displays are up |
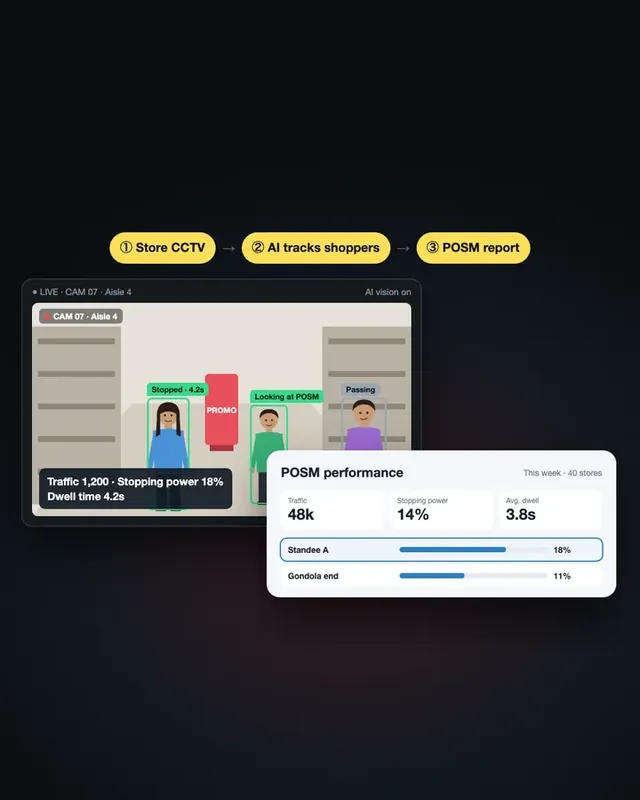
| Display performance | Whether shoppers stop and engage with a display |
How Planogram Compliance Is Checked
Manual audits. Field staff visit stores with a checklist. It works, but it is slow, covers a fraction of stores, and results arrive days later.
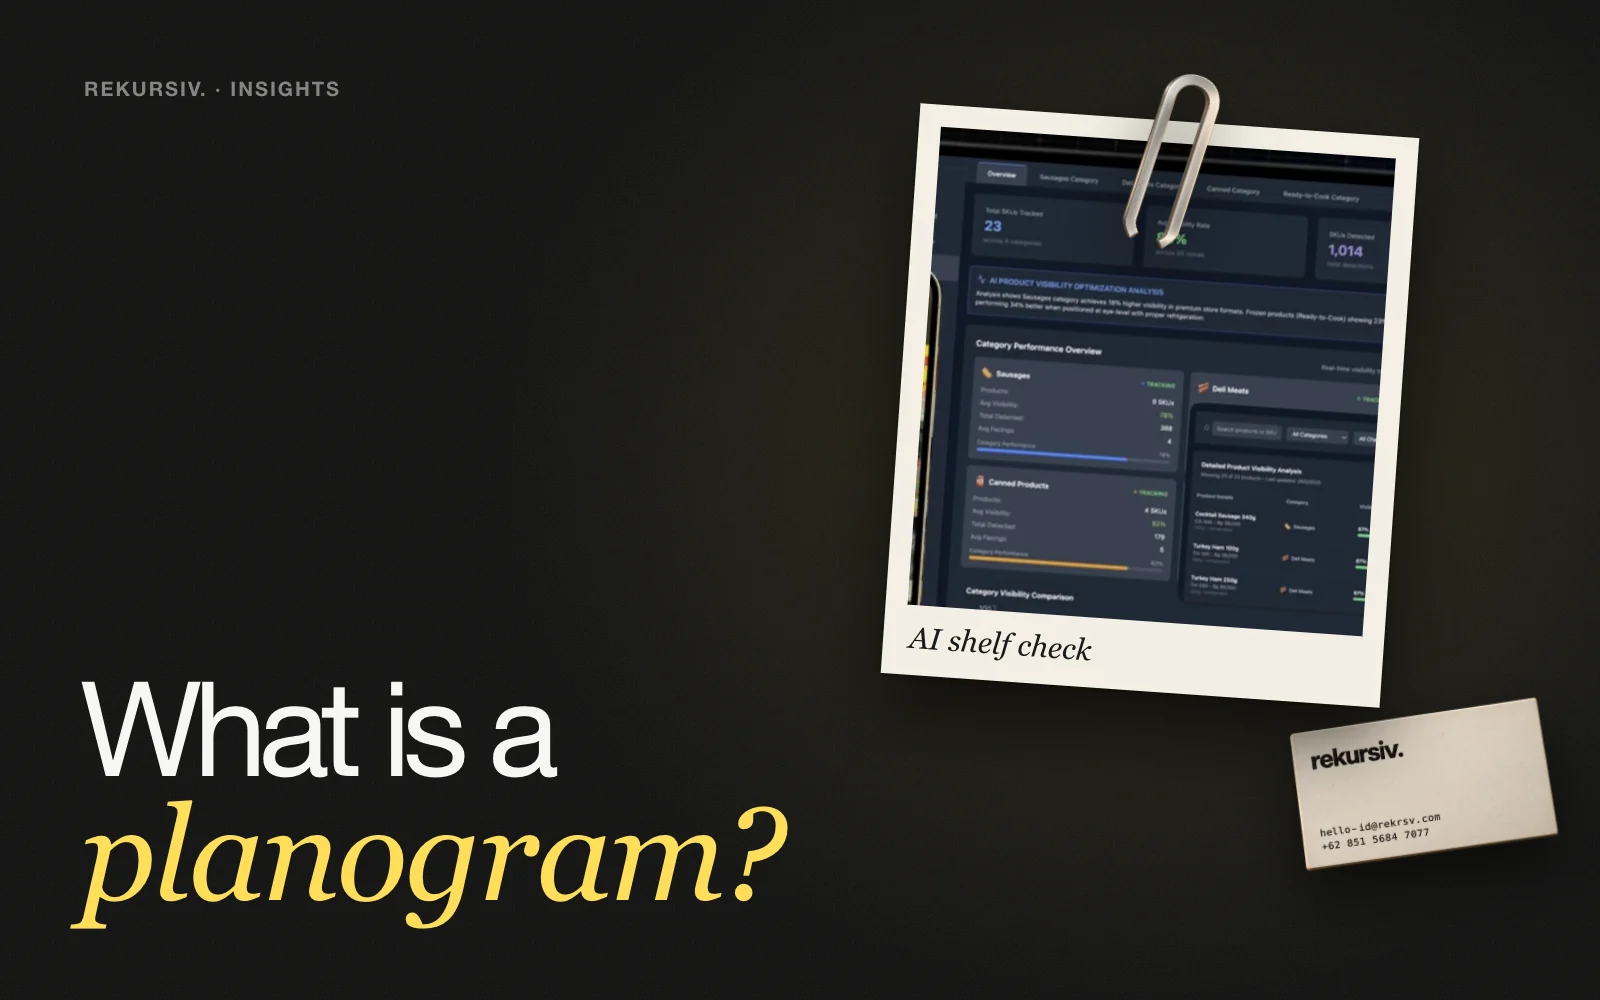
Photo-based AI. Staff take a photo of the shelf. Computer vision identifies each product, checks it against the planogram, flags gaps and out-of-stocks, and measures share of shelf, all on one dashboard across every store.
In-store cameras. For displays, AI vision can also measure how many people pass, stop and engage. In one of our POSM projects, a display recorded 1,200 in foot traffic, 18% engagement and an average dwell time of 4.2 seconds, so the brand could compare locations and move budget to what worked.
Where to Start
- Pick one category and a handful of stores.
- Agree what "compliant" means: products, positions, facings, POSM.
- Run a short pilot with real shelf photos.
- Expand once the numbers match what auditors see on the floor.
Frequently Asked Questions
What is a planogram?
A diagram or plan that shows where each product should be placed on a shelf or display, how many facings it gets and next to which products, so stores present the range the same way.
What is planogram compliance?
How closely the real shelf in a store matches the planogram, usually measured as a percentage of products in the right place with the right number of facings.
Why does planogram compliance matter?
Products that are missing, misplaced or hidden sell less. Compliance protects the shelf space and promotions a brand has paid for.
How do you check planogram compliance?
Traditionally with manual store audits. With AI, field staff take a photo of the shelf and computer vision identifies the products, checks them against the planogram and reports gaps on a dashboard.
What else can a shelf photo measure?
On-shelf availability (out-of-stocks), share of shelf, price and promo materials (POSM), and visibility versus competitors.
Sources
Project figures from rekursiv case studies
- AI shelf monitoring Retail & FMCG
- In-store display (POSM) analytics Retail brands