On-Shelf Availability (OSA): What It Is, How to Measure It and How to Improve It
What on-shelf availability (OSA) means, how to calculate it, why products go missing from the shelf, and how AI checks OSA from shelf photos.
In this article
On-shelf availability (OSA) is the share of products that are actually on the shelf, in the right spot and ready to buy, when a shopper looks for them. It is one of the simplest retail KPIs, and one of the most expensive to get wrong: a shopper who cannot find your product usually buys another brand.
See our AI shelf monitoring service.
What on-Shelf Availability Means
OSA answers one question: is the product on the shelf right now? Not in the warehouse, not in the stockroom, not "in stock" in the system. On the shelf, where the shopper can reach it.
That is why OSA is different from inventory availability. A store can show stock in its system while the shelf is empty, because the cartons are still in the back, the product sits in the wrong aisle, or the count in the system is simply wrong.
How to Calculate OSA
The basic formula is:
OSA = SKUs found on the shelf ÷ SKUs that should be on the shelf × 100%
The "should be" list comes from the planogram or the store's listing. A short example:
| Store | SKUs listed | SKUs found on shelf | OSA |
|---|---|---|---|
| Store A | 40 | 38 | 95% |
| Store B | 40 | 33 | 82.5% |
| Store C | 40 | 40 | 100% |
The out-of-stock rate on the shelf is simply 100% minus OSA. Most teams track OSA per SKU, per store and per week, so they can see which products and which stores keep slipping.
Why Products Go Missing from the Shelf
Most gaps happen in the last few metres, between the stockroom and the shelf:
- Slow replenishment. Stock arrives, but nobody refills the shelf before the busy hours.
- Wrong placement. The product is in the store, just not where the planogram says.
- Phantom inventory. The system shows stock that is not physically there, so no reorder is triggered.
- Promotions. A promo sells faster than forecast and the shelf empties mid-week.
- Shared space. Competitor products or promo displays slowly take over your facings.
How OSA Is Usually Checked
Manual audits. Merchandisers walk the aisle with a checklist. It works, but covers a sample of stores, takes time per visit, and results reach head office days or weeks later.
Sales data. Some teams estimate OSA from sales that suddenly drop to zero. It is cheap, but it only tells you about a gap after the sales are already lost.
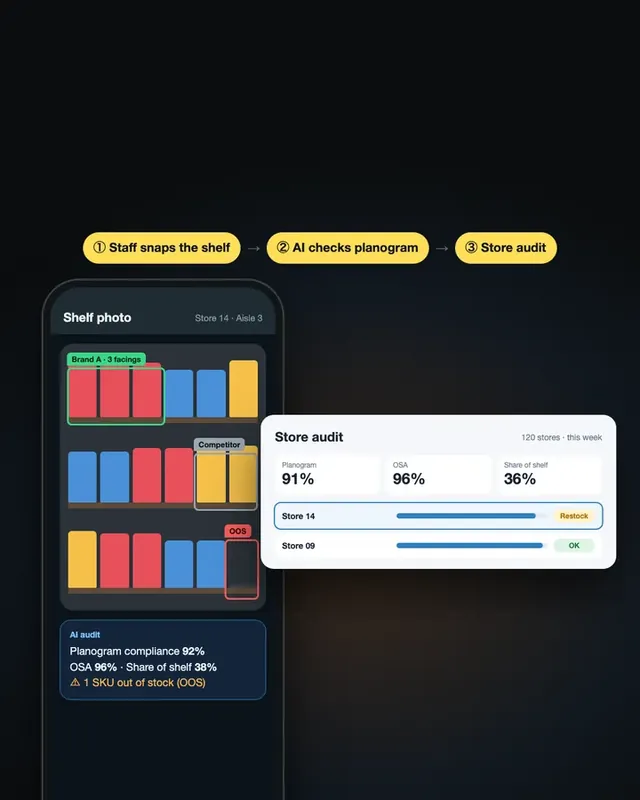
Photo-based AI. Field staff take a photo of the shelf on a normal store visit. Computer vision identifies the products, compares them with the planogram and flags empty or missing facings. Every store lands on one dashboard, so the team can fix a gap the same day.
What We Have Built
Checking every shelf in every store by hand doesn't scale. In our AI shelf monitoring project for retail and FMCG, staff upload a photo of a shelf. Computer vision identifies the products, measures share of shelf and visibility, checks planogram and promo compliance, and reports it all on one dashboard.
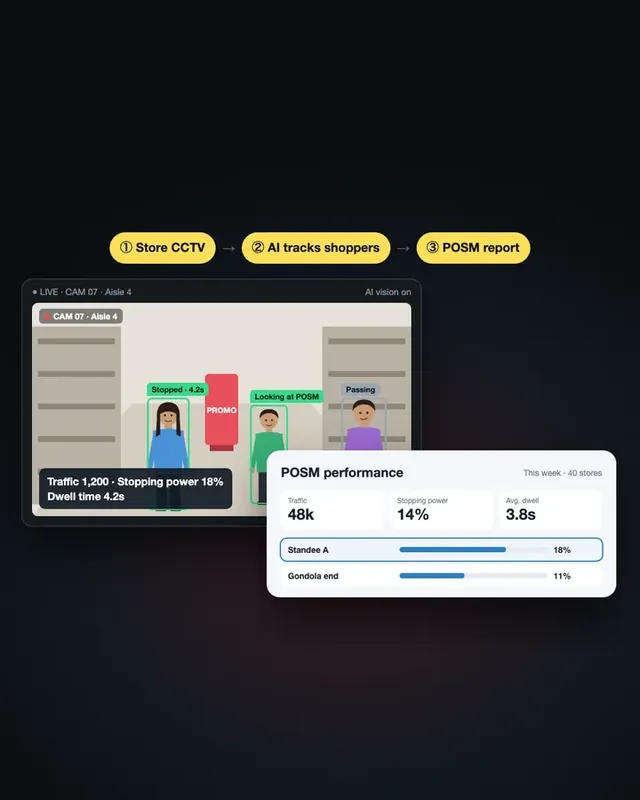
The same computer vision approach also measures what happens in front of the shelf. In our in-store display (POSM) analytics project, AI vision recorded 1,200 in foot traffic, 18% engagement and an average dwell time of 4.2 seconds per display, so the brand could compare locations and move budget to what worked. Availability tells you the product is there; display data tells you whether people notice it.
OSA, Planogram Compliance and Share of Shelf
OSA works best next to two other KPIs:
- Planogram compliance: is the product in the right place with the right facings? Read more in what is a planogram.
- Share of shelf: how much of the shelf your brand holds versus competitors.
One shelf photo can answer all three, which is why photo-based checks are replacing separate audits.
How to Start
- Pick one category and 10 to 20 stores.
- Agree on the SKU list and the planogram for each store format.
- Run a short pilot with real shelf photos from your field team.
- Compare AI results with a manual audit, then set a weekly OSA target.
- Roll out to more stores once the numbers match what auditors see.
Want to see how AI could check OSA across your stores? Talk to us.
Frequently Asked Questions
What is on-shelf availability (OSA)?
On-shelf availability is the percentage of products that are physically on the shelf, in the right place and ready to buy, at the moment a shopper looks for them. It is a core retail execution KPI for FMCG brands and retailers.
How do you calculate OSA?
Divide the number of SKUs found on the shelf by the number of SKUs that should be there according to the planogram or listing, then multiply by 100%. Track it per store, per SKU and over time.
What is the difference between OSA and out-of-stock?
They are two sides of the same number. If OSA is 92%, the on-shelf out-of-stock rate is 8%. OSA looks at the shelf, while inventory out-of-stock looks at the system, and the two often disagree.
Why are products missing from the shelf when there is stock?
Common causes are slow replenishment from the stockroom, products placed in the wrong spot, phantom inventory in the system, and promotions that sell faster than forecast.
How can AI measure on-shelf availability?
Field staff take a photo of the shelf. Computer vision identifies each product, compares it with the planogram, flags empty or missing facings and reports OSA per store on a dashboard.
Sources
Project figures from rekursiv case studies
- AI shelf monitoring Retail & FMCG
- In-store display (POSM) analytics Retail brands