
Customer data, surveys and segmentation that tell you who to build for.
Research & Strategy · Data & analytics · Jakarta
Funnel analysis, behaviour surveys and customer archetypes built with machine learning, turned into dashboards and decisions.
Teams we’ve researched for




What We Do with Your Data
Funnel Analysis & Heatmaps
Where people drop off in the product you already have, with click and scroll heatmaps of the pages that matter.
Behaviour Surveys
Hundreds of answers across regions, designed to measure what people do, not just what they like.
Segmentation & Archetypes
Customer groups built with machine learning, based on how people think and act.
Analytics Setup
Tracking that measures the moments that matter, set up with your team.
Dashboards
The numbers your team needs, in one place it will actually open.
Data-Backed Recommendations
What the numbers mean for product, content and marketing.
Results from Our Research
+251%new visitorsTelkomsel
+301%returning visitorsTelkomsel
5customer archetypesE-commerce · NDA
180people surveyed in 10 citiesContent site · NDA
Data and Analytics, Explained
Why Combine Data and Research
Analytics tells you what people do and where they drop off; research tells you why. Together they show what to fix and how big the gain could be. For one content site, analytics and interviews across 10 cities showed the biggest drop-off was the submission step, and that lighter formats like polls beat a form at the end of a long article.
Segmentation People Can Use
For an e-commerce brand we built 5 customer archetypes with machine learning. People in one category differed more by personality than by age or income, so the strategy followed archetypes, not demographics.
Data That Changes the Result
For Telkomsel’s #JelajahDigital virtual world, the work on what brings people back led to +251% new visitors and +301% returning visitors.
What You Get
Clean data and the right tracking, segments or archetypes your team understands, a dashboard, and a short list of decisions the numbers support.
Why Research with rekursiv.
Researchers Who Also Design and Build
The team that runs the study can design and build the answer, so findings don’t get lost in a hand-over.
Beyond Jakarta
Remote sessions across Indonesia and field days in other cities.
Local Language, Local Context
Sessions in Bahasa Indonesia with people recruited to match your real users.
Evidence You Can Act on
Ranked findings and clear next steps, not a report that sits in a drawer.
Industries: Banking & financeSecurities & tradingPublic services & SOEsTelcoFMCGE-commerceConsumer health

How a Study Runs
- 01Plan the questions that matter to the business, and who to ask.Research plan
- 02Recruit people who match your real users.Screened participants
- 03Observe sessions, interviews or field days, all recorded.Recordings & notes
- 04Analyse patterns across people, with the numbers behind them.Findings
- 05Recommend a ranked list of what to do, and the design to prove it.Recommendations
Research Projects
 Growing a virtual worldGrowing the #JelajahDigital Virtual World
Telkomsel+251% new visitors
 Segmentation to redesignFrom Segmentation to a Tested Redesign
Adult lifestyle e-commerce · Under NDA157 people tested & interviewed
 From content to habitTurning a Content Site into a Habit
Adult FMCG brand · Under NDA180 people surveyed
 Research beyond JakartaReaching Audiences Beyond Jakarta
Adult FMCG brand · Under NDA288 people surveyed
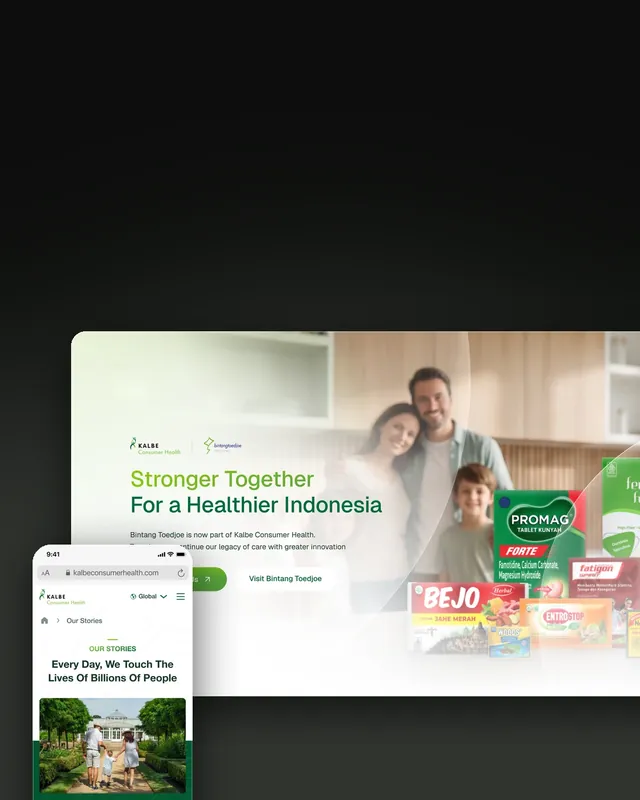 One website, nine countriesOne Website for Nine Countries
Kalbe Consumer Health9 countries launched
Frequently Asked Questions
What does customer data analytics include?
Funnel analysis, behaviour surveys, segmentation and dashboards, combined with research so the numbers come with the reasons behind them.
What is customer segmentation with machine learning?
Grouping customers by how they think and act, using a model that finds patterns in survey and behaviour data, instead of only by age or income.
Can you work with our existing analytics?
Yes. We start with the data you have and add tracking only where a decision needs it.
How big should a survey be?
Big enough for each segment you want to compare; for our national studies that meant a few hundred people across regions.
Do you build dashboards?
Yes, focused on the numbers your team will actually use.
Is our data kept confidential?
Yes. We work under NDA and only share studies by industry, method and scale.
How much does a data and analytics project cost?
It depends on the data sources, survey size and dashboards. We scope it after a short call.
Read More
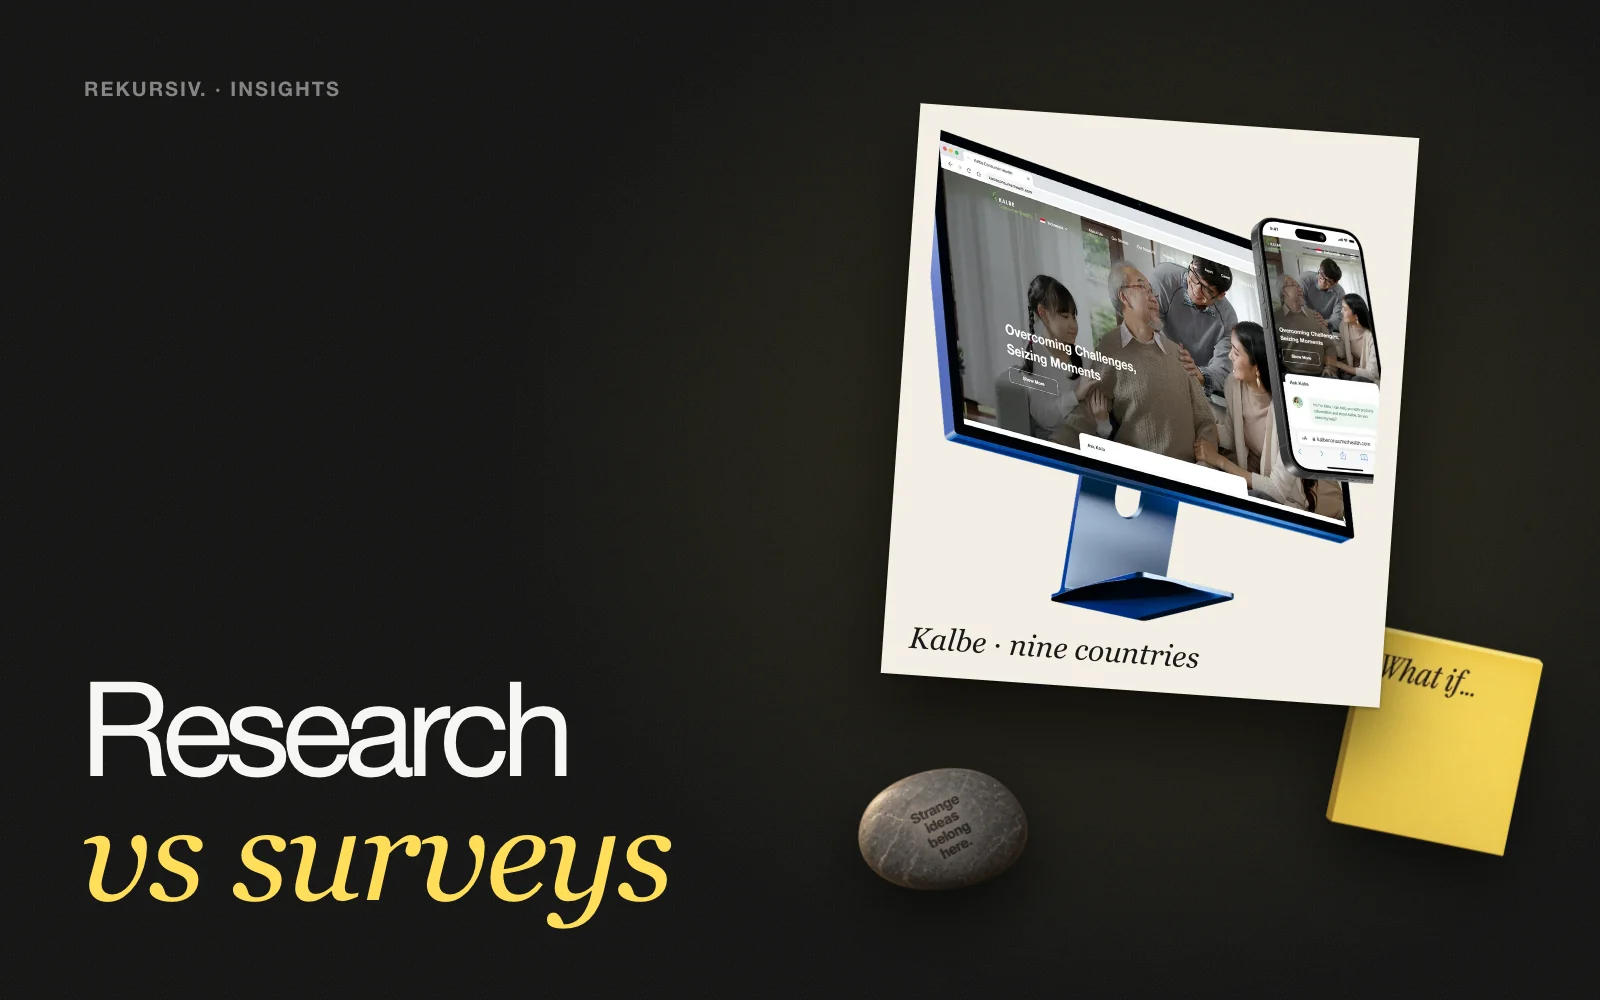 Research & UXUX Research vs Surveys: Which One Do You Need?Surveys tell you what people say; UX research shows what they do. When to use each, how to combine them, and real examples from studies in Indonesia.
 Research & UXUsability Testing: A Practical Guide for Product Teams in IndonesiaWhat usability testing is, when to do it, how many participants you need, the steps, and real results from finance apps and brand websites in Indonesia.
 Research & UXWhat Drives the Cost of Usability Testing (and How to Keep It Lean)The factors that set the price of a usability test: user groups, participants, recruitment, method, cities and what you get at the end. Plus how to keep a study lean.
Next step